
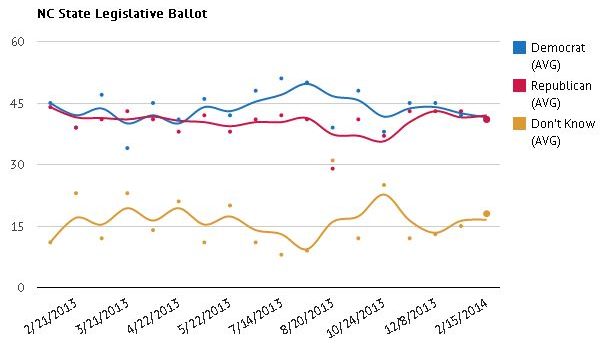
American Insights’ recent statewide poll of 611 North Carolina registered voters finds that the net result of new Republican policies and subsequent protests is a state evenly divided. The NC state legislative ballot shows Republicans and Democrats exactly tied at 41% with 30% definitely voting Republican and 26% definitely Democrat.
Republicans lead the legislative ballot among Independents 38% to 28%, while Republicans earn the vote of 93% of their base to the Democrats’ 85% of theirs. The support of male and female voters almost equally diverges with men supporting Republican legislative candidates 44% to 38% while women support the Democratic candidates 44%-39%. The younger voters (18-34) strongly favor Democratic candidates, by 23 points (50%-27%), while the older voters (65+) anticipate voting Republican by 22 points (55%-33%). Voters 35-49 are dead even at 42%, while those 50-64 opt for Republicans 44% to 39%.
When asked their views on the direction of the state, 34% believe North Carolina is headed in the right direction, but 48% of voters see the state as off on the wrong track. Independents say wrong track by 17 points (32%-49%) and Democrats by 38 points (24%-62%) while Republicans are optimistic with a majority seeing North Carolina headed in the right direction (52%-29%). A majority of women view NC as off on the wrong track (51%-32%). The youngest (18-34) and oldest (65+) are evenly split on the direction of the state (44%-46% and 38%-37% respectively), but the middle two age groups are significantly more pessimistic as those in the 35-49 age range report wrong track by 32 points (29%-61%) and voters aged 50-64 agree by 23 points (27%-50%).
We asked voters if they felt more or less confident in their economic future today than they did two years ago. 46% feel less confident in their economic future, compared with 26% who feel more confident. Democrats and younger voters (18-34) are the most optimistic at 38% and 40% more confident respectively. Republicans claim to be less confident 61% to 18%, while Independents are less confident 48% to 23%. While a full 50% of women are less confident, compared to 22% more confident, 42% of men are less confident versus 31% more confident. All age groups except the youngest (18-34), are less confident by margins of 27 to 29 points. Voters 18 to 34 are more evenly divided at 40% more confident to 43% less confident.
For full results, click here.


SOCIAL COUNTER
To RSS Feed
Followers
Fans