
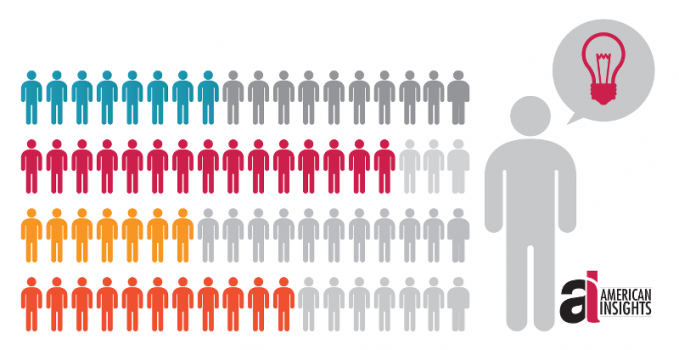
39% of likely voters watched Hagan-Tillis debate, judged Hagan the winner by a 54% to 33% margin; 79% of likely voters have seen or heard political ads, but only 21% say ads influenced their opinion; 68% say that control of US Senate a factor in voting decision
Our new American Insights poll shows Senator Kay Hagan with a 9-point lead, at 43-34, among Likely Voters. She leads among men, women and Independents. NC House Speaker Thom Tillis leads both among white voters and native North Carolinians. Nearly two-thirds (64%) of voters who chose Libertarian Sean Haugh (5%) say they do so because they don’t like the other two candidates or parties. However, 82% of Haugh supporters would consider voting for another candidate when the time comes to cast their ballot.
“After being deadlocked for most of the year, the race has unmistakably shifted towards Senator Hagan in recent days. This poll is a continuation and affirmation of the very recent trend in Sen. Hagan’s direction. But there is still a lot of time left on the clock, and we would not be surprised if this volatile race shifts back to a jump ball between now and November,” said American Insights Director Pearce Godwin. “Our AI Trend Chart has shown Hagan and Tillis trading leads within the margin of error since January with the exception of July when Senator Hagan opened up a six-point lead. But by August, the race had reset at a dead heat and was exactly tied through last month. But the last four polls released in the past 10 days, including today’s AI survey, show a lead for Hagan ranging from 3 to 9 points. Because the AI sample nearly perfectly reflects the North Carolina voter population, it appears that the shift over the last two weeks is real.”
Key Trends
- AI Trend Chart shows Hagan and Tillis trading leads within the margin of error since January with the exception of July when Senator Hagan opened up a six point lead as Speaker Tillis was managing the legislative session in Raleigh. Since the close of the legislature, the race had reset at a dead heat, and was exactly tied through August.
- American Insights poll shows Hagan with a 9 point lead, at 43-34, among Likely Voters on the three way ballot, including Libertarian Sean Haugh.
- Last four polls released in the past 10 days, including this survey, have shown a lead for Hagan ranging from 3 to 9 points.
- New AI Trend Chart lead for Hagan is 6 points, at 45-39.
- Last three polls (Rasmussen, Civitas, American Insights) were conducted over some of the same days, each ending on September 10th.
- Each of the last three polls was conducted after the first candidate debate and subsequent media coverage. 39% of Likely Voters in American Insights poll reported watching the debate, and 54% of those believed Hagan performed better, compared to 33% for Tillis.
- 79% said they have seen or heard political advertisements regarding the Senate race, 37% of those multiple times per day with another 29% being exposed daily. Only 21% claim the ads have influenced their opinion.
- Our triple helix sample nearly perfectly reflects the North Carolina voter population, suggesting that a real shift has taken place in this race over the last two weeks.
- This poll is a continuation and affirmation of the very recent trend in Sen. Hagan’s direction.
- Our measure of Hagan’s support is consistent with the level she’s maintained for a while, low 40s, which for an incumbent Senator could spell trouble.
- However, we detect a recent decline in Speaker Tillis’ support, now in the 30s.
- ‘Incumbent Rule’ suggests that an incumbent’s level of support relative to 50% is a better indicator of where the race stands than the margin separating the two contenders, as undecideds have been known to break for the challenger by Election Day.
- However, Tillis needs to remain closer to Hagan in order to ride a late undecided tide into the Senate, potentially carrying a new Republican majority with him.
- 68% of likely voters say the issue of which party controls the US Senate after November will be a factor in their vote.
- 31% consider their vote for Congress a vote against Obama, 21% consider it a vote for Obama and 42% don’t consider the President a factor in their vote.
- A majority, 55%, of likely voters are more enthusiastic about voting than usual while 24% are less enthusiastic.
- 38% would trust Tillis more than Hagan to run their business; slightly fewer, 36%, would trust the current Senator more. American Insights’ February poll found that voters valued business experience in a Senator more than experience in any other field.
Senate Ballot
- Among all Registered Voters who say they are “Extremely Likely” to vote (56%), Hagan leads by 10, 45-35. Among those RVs who rate their chance of voting at 10 (58%), Hagan leads by 9, 45-36.
- Among all RVs who say they’re paying “quite a lot” of attention to politics, Hagan leads by 9, 44-35.
- Among all RVs who are “more enthusiastic” about voting than usual, Hagan’s lead is a narrower 43-40.
- With Likely Voters, Hagan is leading Tillis among both women (+13: 44-31) and men (+4: 41-37).
- Men and Women are equally likely to say they are definitely voting for Hagan, 34% & 35%.
- Men are more likely to say they are definitely voting for Tillis, 32% vs. 21%.
- Senator Hagan is performing much more strongly with younger voters than older. Her advantage among LVs 18-34 is 17% and 16% among 35-49 but just 4% among 50-64 and nearly tied (+1%) among LVs 65+.
- Tillis is leading by 6 points (42-36) among White LVs but is losing Black voters to Hagan by 65 points (73-8).
- The candidates’ partisan bases are similarly coalesced behind them as Hagan is leading among Democrats by 72 (79-7) and Tillis leads among Republicans by 69 (76-7).
- Independents narrowly favor Hagan, 35 to 34. 19% of Independents are Undecided or Leaning, with 5% leaning towards Hagan and 2% leaning towards Tillis. Another 5% are leaning towards Haugh.
- Tillis is leading among Conservatives by 55 (67-12), while Hagan leads among Liberals by 74 (78-4). Moderates LVs favor Hagan by 30 (51-21)
- Tillis is leading Hagan among LVs who were born in North Carolina, 39-38. However, the Senator leads among voters who have moved here from other states. By far her largest lead among these non-natives is with those who have lived in NC btw 11 and 20 years, +40. This likely voter group was consistently the most favorable to Hagan across multiple questions.
- Hagan leads in three of five NC regions: Charlotte (+14), Mountains (+15) and Triangle (+25). Hagan earns a strong 54% of LV support in the Triangle. Tillis leads in Hagan’s home Triad (+4) and Coastal Plains (+6), where Tillis earns 42%.
Haugh Effect
- More men than women support Libertarian Sean Haugh, 8% vs. 3%. His greatest support comes from the Triad, 9%.
- When given a choice on the two-way ballot between only Hagan and Tillis, the 5% who initially supported Haugh slightly favor Tillis, 39%-32% over Hagan, with 29% not picking either of the two major candidates.
- Nearly two-thirds (64%) of registered voters who chose Haugh say they do so because they don’t like the other two candidates or parties.
- 82% of likely voter Haugh supporters would consider voting for another candidate when the time comes to cast their ballot.
- Without Haugh, Senator Hagan’s lead remains 9 points at 47-38 on the two-way ballot.
Debate Impact
- Nearly half (47%) of young voters (18-34) claimed to watch the first debate, more than any other age group.
- More Independents (44%) and Democrats (42%) say they watched the debate than Republicans (34%).
- Almost half (48%) of Charlotte Area LVs say they watched the debate.
- 57% (+28) of Female LVs and 50% (+13) of Males say Hagan performed better in the debate.
- White LVs gave Hagan the nod by 3 points, 45-42.
- 69% of Republicans saw Tillis as the winner, while 83% of Democrats saw their candidate on top. 55% of Independents give Hagan the win, compared to 36% for Tillis.
- Two-thirds (67%) of viewers in the Mountains believe Hagan won, while Charlotte, where viewership was highest, narrowly opted for Hagan, 45-43.
- 57% of LVs aged 18-34 said they learned something about the candidates they didn’t know before by watching the debate, as did 54% of Black voters.
- 50% of Democratic debate viewers said they learned something new, whereas only 43% of Republicans and 38% of Independents did.
- 67% of LVs in the mountains learned something new from the debate.
- Among LVs who watched the debate, Hagan leads 50-31.
- Among LVs who watched and thought Hagan won, she leads 86-2.
- Among LVs who watched and thought Tillis won, he leads 82-7.
- Among LVs who watched and learned something new about the candidates, Hagan leads 58-24.
Advertising Impact
- More than two-thirds of all LV age groups report having seen or heard senate ads, 87% of those 50-64 and only 69% of those 18-34.
- More Independent LVs (85%) have seen or heard ads than other partisan groups.
- However, Independents are least likely (29%) to have seen or heard ads multiple times per day, compared to 39% of Republicans and Democrats. On the other hand, Moderates (40%) are most likely to have seen them multiple times per day.
- Republicans (27%) are most likely to admit that they have been influenced by the advertising.
- LVs in the Mountains (63%) are least likely to have been exposed to ads, while 88% in the Charlotte Area and 86% in the Triangle have been.
- 47% of LVs in the Triangle have seen or heard ads multiple times per day versus only 9% of those in the Mountains.
- More in the Coastal Plains (24%) acknowledge being influenced than LVs in other regions.
- Among the 79% of LVs who have seen or heard ads, Hagan leads 45-34.
- Among the 18% of LVs who have not seen or heard ads, Tillis leads 36-35.
- Among LVs who say they’ve been influenced by the ads, Hagan leads 48-33.
- Among LVs who’ve been exposed to ads multiple times per day, Hagan leads 53-30.
Senate Control Factor
- 72% of Men and 65% of Women say the issue of which party controls the US Senate will be a factor in their vote.
- More Democratic LVs (78%) than Republicans (67%) are considering Senate control. 62% of Independents consider it a factor.
- LVs in the Mountains (77%) are most likely to be thinking about Washington as they cast their vote.
- Among LVs for whom Senate control is a factor, Hagan leads 46-37.
Obama Factor
- President Obama is a factor in the vote of 49% of Male LVs and 54% of Females. Among these, men are more likely to consider their vote against Obama (33-16). Women are more evenly divided with 29% voting against Obama and 25% voting in affirmation of him.
- Young LVs (18-34) are the only age group voting to support Obama (+2).
- 27% more white voters (39-12) are voting against the president than for him, whereas nearly half of black voters (49%) are voting in affirmation of Obama with only 4% voting in opposition.
- Two-thirds (66%) of GOP LVs consider their vote as one against Obama, while only 43% of Democrats are voting in support of him. 30% of Independents are casting a vote against Obama with only 13% for the president.
- By this measure, the Triad is most actively opposed to the president (-21), with the Triangle having more LVs supporting Obama with their vote (23-20).
- Among LVs considering their vote as for Obama, Hagan leads 79-5. Among those casting a ballot against Obama, Tillis leads 74-8.
Trust More to Run Business
- Men would trust Tillis more to run their business (42-36), while Women narrowly trust Hagan more (36-35).
- Young voters (18-34) are the only age group that would trust the senator more, 34-31.
- White LVs would trust Tillis more by 15 while Black LVs trust Hagan more by 48.
- Independents would trust Tillis more, 44-34. But Moderates would trust Hagan more, also by 10 points, 39-29.
- North Carolina natives would trust Tillis more, 44-33.
- Among LVs who would trust Hagan more, she leads 89-2.
- Among LVs who would trust Tillis more, he leads 78-6.
- Among LVs who would not trust either one of them, Hagan leads 31-14.
- American Insights’ February poll found that voters valued business experience in a Senator more than experience in any other field.
Hagan Approval
- Hagan enjoys net approval among Female LVs (48-40), but men narrowly disapprove (44-46).
- The Senator has by far her highest net approval with young LVs (+24) but is well under water with those aged 65+ (-16).
- White LVs give Hagan a -13 net approval with 52% disapproving, but Black voters give a +66 performance rating.
- Independents slightly approve of Hagan (46-43).
- While the partisan bases have parity in the degree of their respective approval (+69) and disapproval (-71). Liberals are more solidly coalesced in support of Hagan (+74) than Conservatives are against (-62).
- North Carolina natives disapprove of Hagan’s performance (42-48).
- Hagan’s home Triad region is least approving (-16), while the Triangle offers her strongest support (+15).
- Among LVs who approve of Hagan’s performance, she leads 82-4.
- Among LVs who disapprove of Hagan’s performance, Tillis leads 71-6.
- Among LVs who are undecided on Senator Hagan’s performance, she leads 29-14.
Turnout
- Our Likely Voter model was built based on each registered voter’s composite score on the four initial turnout questions in the survey.
- Among all Registered Voters, 59% of Men and 53% of Women say they are “Extremely Likely” to vote. This is also true of 69% of 65+, only 38% of 18-34, 59% of Whites, 48% of Blacks, 55% of Republicans, 57% of Democrats and 62% of Independents.
- Among all RVs, 59% of Men and 56% of Women rate their chance of voting at 10, as do 75% of 65+, 27% of 18-34, 59% of Whites, 54% of Blacks, 55% of Republicans, 62% of Democrats and 58% of Independents.
- Among all RVs, 35% of Men and 31% of Women report “Always” voting, as do 52% of 65+, 30% of Whites, 37% of Blacks, 34% of Republicans, 32% of Democrats and 33% of Independents.
- Among all RVs, 55% of Men and 48% of Women say they’re paying “Quite a Lot” of attention to politics, candidates and the upcoming elections, as do 68% of 65+, 32% of 18-34, 54% of Whites, 43% of Blacks, 51% of Republicans, 53% of Democrats and 56% of Independents.
- Among all RVs, 51% of Men and 42% of Women say they are “More Enthusiastic” about voting than usual, as do 56% of 65+, 35% of 18-34, 47% of Whites, 48% of Blacks, 52% of Republicans, 46% of Democrats and 46% of Independents. This question was not included in the Likely Voter model.
- Among Likely Voters, 77% of women rate their chance of voting at 10, vs. 71% of men.
- Only 47% of young (18-34) LVs rate their chance of voting at 10.
- A majority (57%) of LVs 65+ say they “always” vote. All other age groups are in the 30s.
- 73% of LVs aged 50+ say they’re paying “quite a lot” of attention to politics. Only 53% of those under 50 say the same.
- 60% of Black LVs are more enthusiastic than usual about voting, compared to 56% of Whites.
- 61% of Republican LVs are more enthusiastic than usual, compared to 53% of both Democrats and Independents.
- More native North Carolinian LVs (58%) are more enthusiastic than usual about voting than non-natives.
- More LVs in the Coastal Plains are more enthusiastic than usual about voting than those in other regions of the state.
*All data among Likely Voter universe unless otherwise stated.
METHODOLOGY: American Insights surveyed 600 Registered Voters in North Carolina between September 5th and 10th, then determined 459 to be Likely Voters based on four turnout questions. The margin of error is ±4.0% for Registered Voters and ±4.6% for Likely Voters. ‘Triple Helix’ mixed modal surveying methodology included 50% live landline phone, 20% cell phone and 30% online. All respondents were asked questions concerning basic demographics and the sample was designed to accurately reflect the actual registered voter population in North Carolina according to age, race, gender, geographic area and party registration. On party registration, the registered voter sample precisely matches the registered voter population at 42% Democrat, 31% Republican, 27% Unaffiliated. Email Pearce@AmericanInsights.org for crosstabs.


SOCIAL COUNTER
To RSS Feed
Followers
Fans